Tanks and Vessels
The Problem
Heat tracing is applied to tanks and vessels to ensure that products are stored at the correct temperature. Usually the system is designed to compensate for losses through the thermal insulation although there are some cases where there is a positive heat input to raise the temperature of the vessel under defined conditions. The thermal insulation is the first line of defence against unknown, and often unquantifiable, losses from a bare surface.
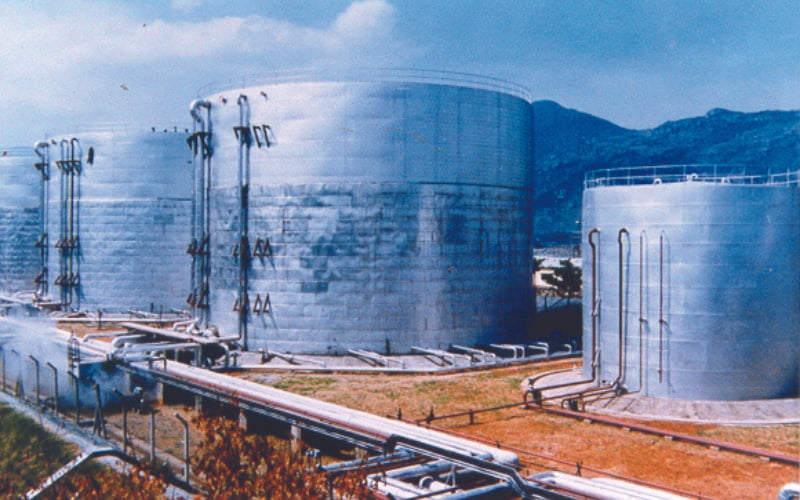
How is heat lost from a tank?
There are three ways to lose heat from a tank or vessel:
- By conduction through the structure and any thermal insulation layer. Heat flows from the contained medium through the walls, floor and roof and fittings attached to the tank and is dissipated to the surroundings by . . .
- convection effects that may be natural convection, where there is no wind movement, or forced convection, where there is movement of the surrounding atmosphere. This is particularly noticeable outdoors where the convective losses can be quite severe at higher wind speeds.
- The remaining mechanism for losing heat is radiation. All bodies radiate heat if they are hotter than their surroundings. Therefore, the outer cladding of a tank or vessel will lose heat by radiation to a colder surrounding atmosphere. This effect increases with temperature and is independant of any convective losses. This effect is most noticeable at surface temperatures above 100°C.
The Solution
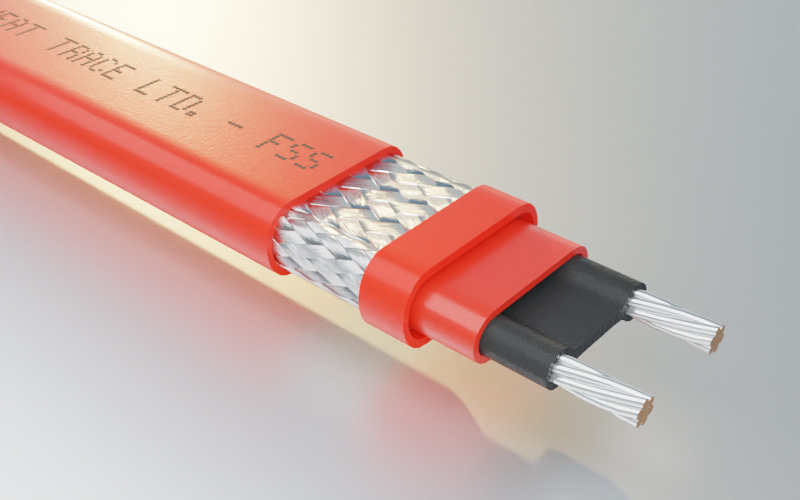
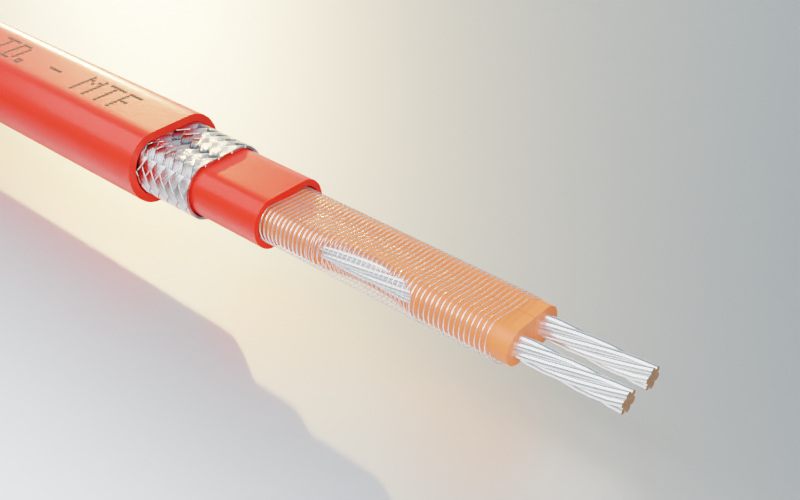
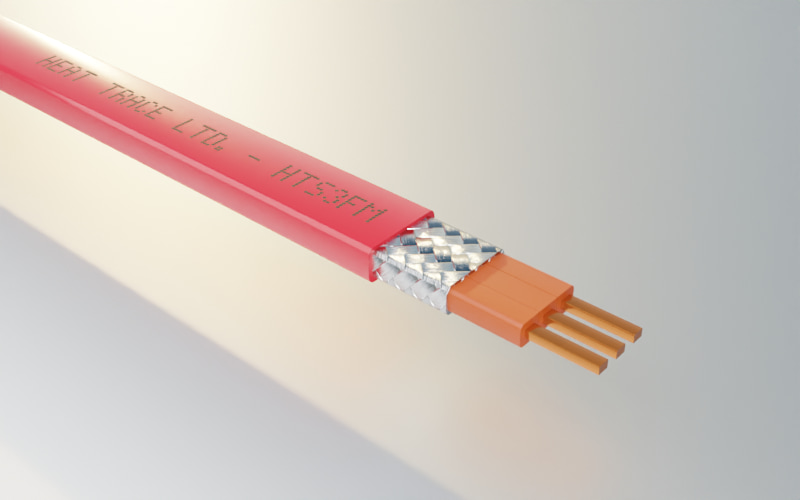
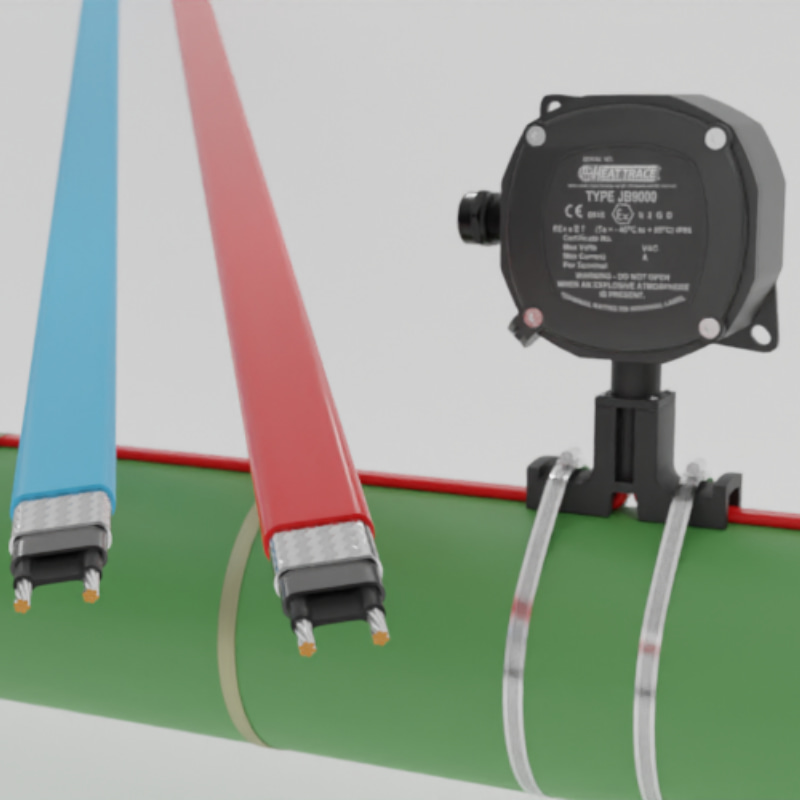
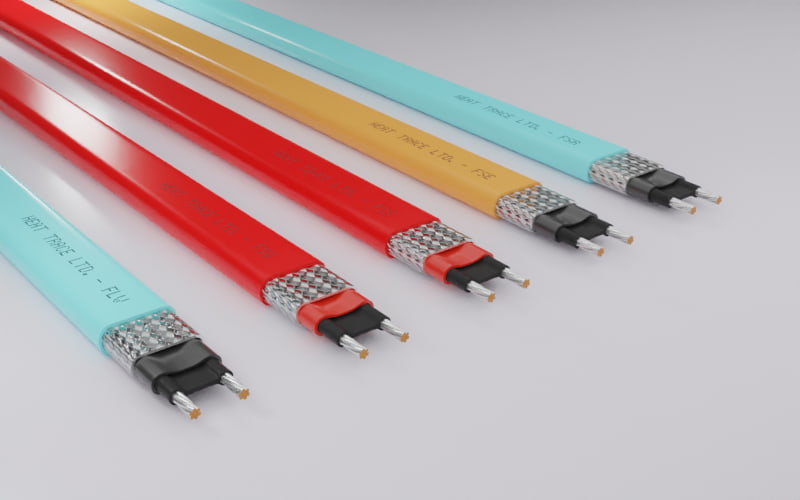
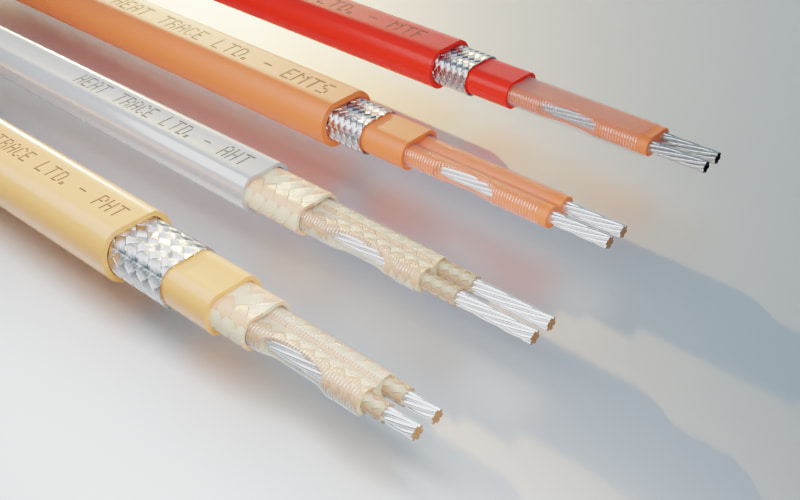
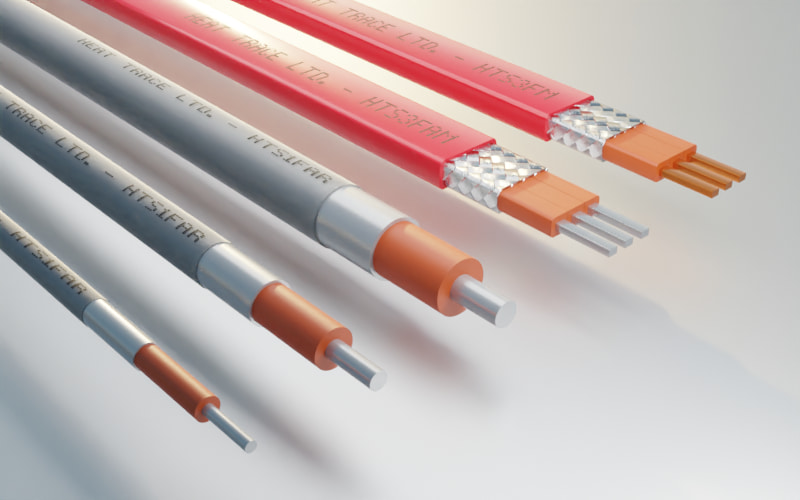
Once the heat losses have been calculated you can determine the amount of cable required based on the heat losses and size of the tank. If the cicuit lengths are less than 200m then parallel resistance self regulating (eg.Freezstop Regular) or constant power heating cables (eg. MiniTracer) are chosen which can be cut to length when required on site. When longer circuit lengths are required, series resistance cables should also be considered (eg. Longline).as these can normally be installed in a single circuit or supply point.
View the Heat Trace Cable Range Max Exposure Temperature & Output Capability Graph:
